LawrenceWave™
A custom, fractal-like analysis of tick-by-tick market data that removes noise whilst keeping sufficient signal, so human users can see the structure of market movements.
It also provides useful input to training AI models, so they can predict future movements with a probability better than randomness.
Waves, and degrees of them
We've used billions of historic tick prices, going back to the beginning of crypto, to produce waves — each one a straight line between two points. The first waves produced from the tick-by-tick data are waves of degree zero.
We then consolidate, fractal-like, into waves of a higher degree — degree 1 — further removing noise and preserving signal.
One model for each degree
We've written a custom algorithm to consolidate the waves to higher and higher degrees.
Training an AI model needs at least 100,000 data points. The finest waves — D0 to D2 — are too small to be of use to a trader; above D7 there aren't enough waves to train on. D3 to D7 has both: waves worth trading, and enough of them to learn from.
Each degree has its own model. When a wave completes, we send the latest waves of that degree to the appropriate model and ask it to predict the next wave, and the one after it.
A wave is only known to be complete once price has moved in the opposite direction — so by the time a prediction is made, the next wave is already partly formed.
Reading a prediction
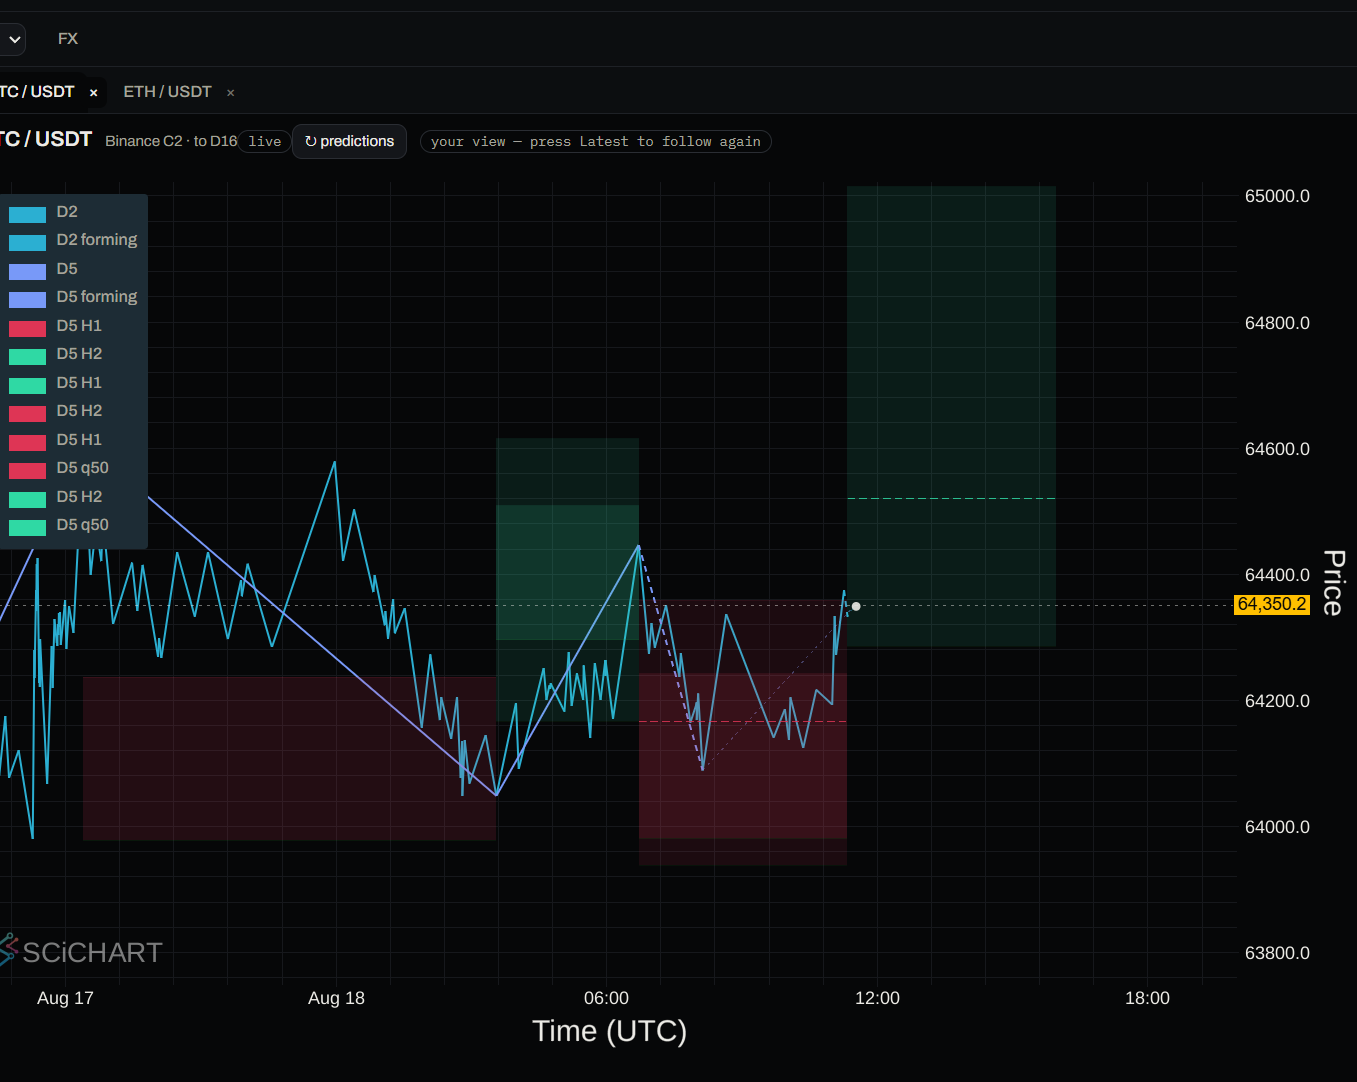
Predictions are shown on the chart as price bands, with a dashed line indicating the most likely price movement.
Beta access — 100 places
Open to traders with at least 12 months of crypto experience. Your first year is free, then 50% off for life.